Notes on Adopting ELK
Our company's statistics workload had been putting heavy pressure on the system. The MySQL cluster hit a query bottleneck, and index tuning could no longer deliver stats results fast enough — so we adopted the three-piece open source combo: Elasticsearch, Logstash, and Kibana.
Some background first. Statistical queries are a different beast from ordinary business queries. Business queries mostly fetch a handful of rows by primary key or index — exactly what MySQL is good at. Statistical queries, on the other hand, tend to scan large amounts of data for grouping and aggregation, where B+ tree indexes offer limited help. Once the data volume grows, a single stats SQL can take seconds or even tens of seconds, dragging down business requests on the same database. The common answer is to peel the statistics workload off the OLTP database and hand it to an engine built for aggregate analysis. Under the hood, Elasticsearch combines inverted indexes with columnar doc values, which makes it a natural fit for filtering and aggregation — and the ELK stack is one of the most approachable options in the community, so it seemed worth writing down.
Choosing the Tools and Dividing the Work
As an alternative to Logstash, Alibaba's DataX would also work — its feature set actually goes a step further than Logstash's. I stuck with Logstash, simply because I only learned about DataX later on and saw no reason to swap it out.
The two are positioned somewhat differently. Logstash is the Elastic family's data pipeline: its jdbc input plugin pulls data on a schedule, a config file is all it takes to get running, and the Elasticsearch output integration comes ready-made. DataX is Alibaba's open source tool for syncing across heterogeneous data sources, with broader plugin coverage and stronger batch throughput. For a single pipeline like "scheduled incremental sync from MySQL to ES," Logstash is plenty — no point in switching for switching's sake.

The division of labor across the three components is clean:
Logstash extracts and filters the statistics data from MySQL and incrementally syncs it into Elasticsearch.
The application then queries Elasticsearch through the Java API.
Kibana provides a web UI for visualizing the cluster and inspecting index details.
In other words: Logstash handles data in, the Java application handles data out, and Kibana makes the health of the cluster and indexes visible. The three stay out of each other's way.
Elasticsearch queries themselves are fairly simple, but the official docs feel light on examples — many of the trickier aggregations you have to figure out yourself. For things like multi-level nested aggregations or sorting on aggregation results, the documentation usually only gives the most basic sample, and in real business scenarios you end up dialing them in bit by bit through Kibana's Dev Tools.
Overall the learning curve isn't steep. It's quick to pick up.
The Java Integration
For the Java API, we used the elasticsearch-rest-high-level-client jar.
On top of it, I built a factory tailored to our business scenarios and abstracted a few layers of code for the other developers. The goal of the wrapper is simple: I didn't want every developer hand-assembling SearchSourceBuilder and parsing SearchResponse directly. Instead, the common patterns — condition filtering, pagination, aggregation — are collapsed into a handful of methods, so business code only cares about passing parameters and getting results.
The API's query and result-handling methods can feel a bit clunky to work with, but as long as you write the code against the query statement itself, it's actually easy to follow. The high level client's builder structure maps almost one-to-one onto the Query DSL's JSON structure: get the DSL working in Kibana first, then translate it into Java, and you'll rarely go wrong.
The overall experience was quite friendly. All the software works right after installation, though you do need to tweak the configuration — I won't go into detail here: IPs and ports, language settings, passwords, and so on.
Sync Only the Fields the Stats Need
Our company's work is mainly statistics, so we had Logstash extract only the key statistical data — for millions of rows, the extracted stats fields came to less than 100 MB. This dramatically speeds up ES aggregations, so I'd advise against pulling in entire tables; take only the fields that matter most for statistics.
This point deserves elaboration. Elasticsearch runs its aggregations over memory and doc values: the leaner the index, the smaller the segment files, the higher the proportion that can be cached — and the faster the aggregations. Besides, ES is not a database and doesn't need to shoulder the job of storing full detail records. The source of truth for detail data is always MySQL; ES holds only the statistical dimensions and metric fields. If anything breaks, the index can be rebuilt at any time, which takes a lot of weight off your mind.
The full pipeline looks like this:
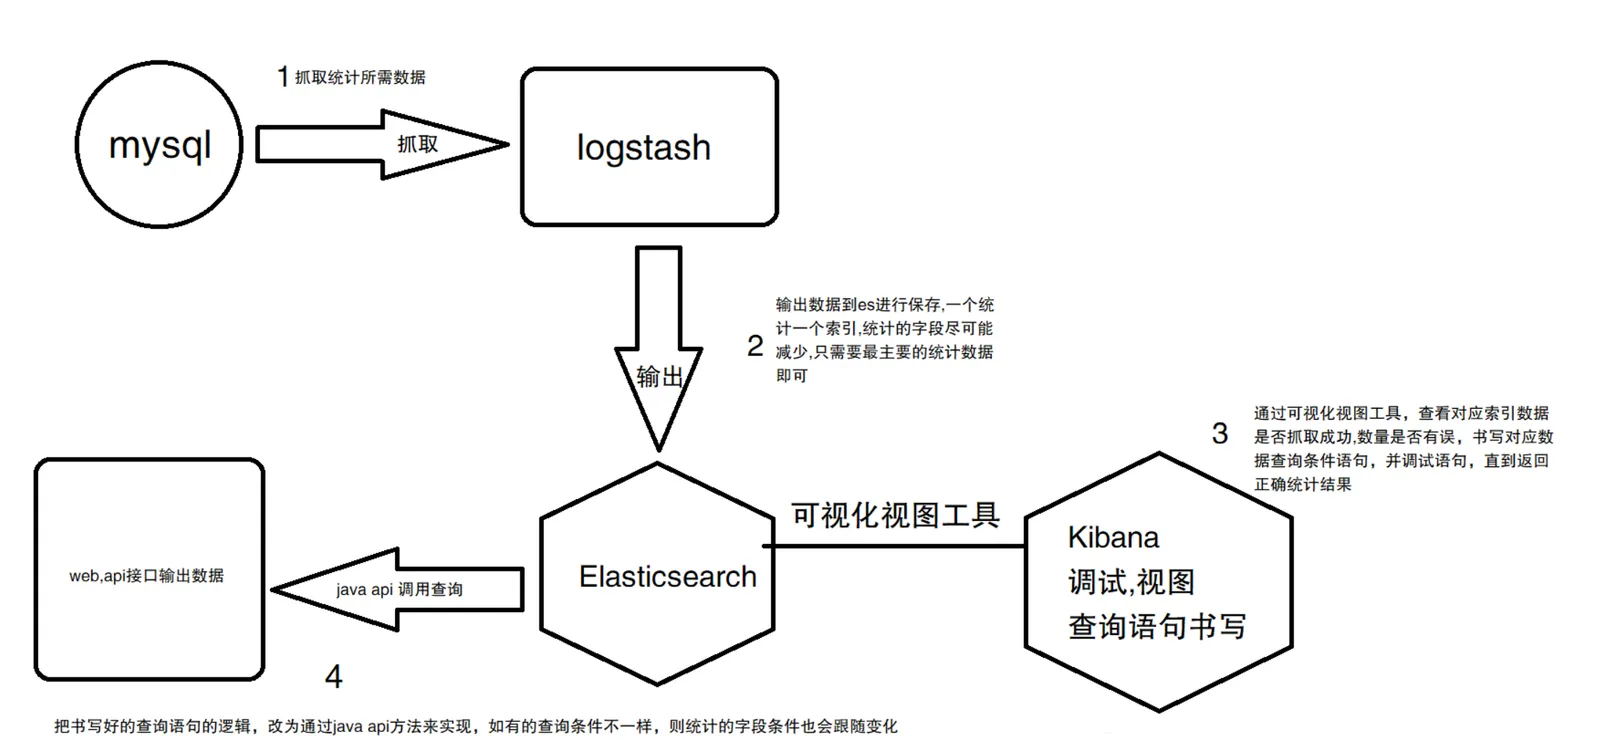
This is the flow diagram I drew for our company's team.
If the extraction volume were extremely large, you could put Kafka in the middle as a buffer for a second round of filtering. Since our data volume isn't anywhere near that level, there was no need to burn extra server resources on it. The value of a message queue in the middle is peak shaving and decoupling: when upstream extraction and downstream writes run at different rates, the queue absorbs traffic bursts, and it also gives you a convenient place to hang extra cleansing logic. But every additional component is additional operational cost — if the volume doesn't call for it, don't add it.
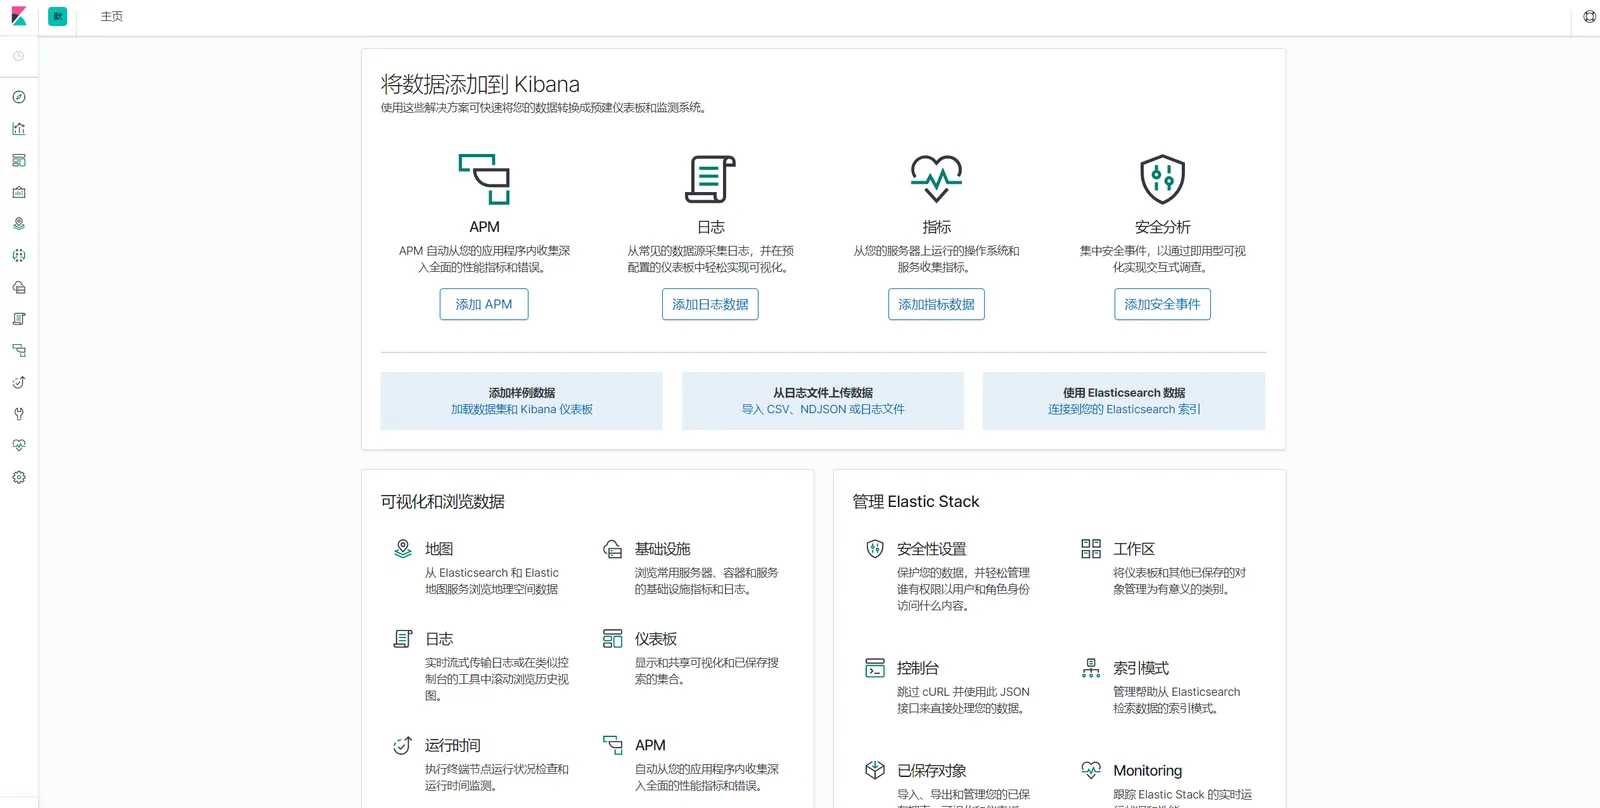
Kibana is quite mature by now. You can write the official Query DSL, or plain SQL — though the official recommendation is still to use the Query DSL for aggregation and querying.
Implementing Incremental Sync
For incremental sync and syncing updated rows, my approach was to add a data_version field to the source tables (the optimistic locking idea — a data version number). Whenever a row is modified, or a new row is inserted, data_version gets set. I used a timestamp (for business reasons at our company), and I recommend making this field a bigint — the timestamp type only works up to 2028.
This gives every row a version. During incremental and update sync, only rows whose data_version has changed get picked up, greatly reducing the load on the MySQL servers, Logstash, and Elasticsearch.
Logstash can record the data_version value of the last row from the previous run. On the next run, that previous data_version value goes into the where clause to filter out just the rows that matter. The SQL must sort by data_version, because Logstash only remembers the data_version of the final row of the previous run.
Behind this is the tracking column mechanism of the Logstash jdbc plugin: the plugin persists the tracking column value of the last record from the previous run to a local file, and on the next execution passes it into the where clause as a parameter. That's why the sort is mandatory — if the result set isn't ordered by data_version ascending, the recorded "last row" isn't the maximum value, and the next sync round will miss data.
Otherwise, would you do a full-table sync every single time? You can imagine the load. Surely nobody would go that route — a full sync only happens on the very first run. Everything after that is incremental and update sync.
The reason updated rows also make it across is that each row is written to ES with a fixed document id (usually the MySQL primary key). When a row's version changes, it gets picked up again, and writing it into ES is simply an overwrite — no duplicate documents.
Pitfalls and Caveats
-
Think carefully about the tracking column's type. As mentioned above, when using a timestamp as the version number, make the field a bigint to avoid the upper-bound issue of the timestamp type. Also, if the timestamp's precision is too coarse, multiple modifications within the same second can slip through at the boundary — either the business can tolerate that, or switch to a monotonically increasing sequence.
-
Physical deletes don't sync. The data_version scheme only detects inserts and updates; rows deleted directly in MySQL simply stop appearing in the result set, leaving stale documents behind in ES. Either use soft-delete flags in the business layer so a delete becomes just another "update" that syncs across, or rebuild the index periodically as a safety net.
-
Don't treat ES as your only store. The stats index in ES should always be replayable from MySQL. That way, if the mapping design turns out wrong or a field needs adding, you just drop the index and rerun Logstash — no complicated online migration.
-
Always verify the incremental SQL's ordering and boundary conditions. Greater-than versus greater-than-or-equal in the where clause, whether the sort actually takes effect — run the SQL by hand first, then compare the recorded values across two Logstash runs to confirm nothing is missed or fetched twice.
Wrapping Up
The core win from adopting ELK was peeling statistical aggregation off the MySQL cluster: Logstash does incremental sync based on data_version, pulling only the fields the stats need; Elasticsearch handles the aggregate queries, wrapped on the Java side with the high level client for business use; Kibana covers both DSL debugging and cluster monitoring. The whole setup introduces no unnecessary components — the trade-offs follow the actual scale of the data. Enough is enough.
COMMENTS